Challenges in Lifetime Value Predictions for Marketing Campaigns
By Shahar Bar, Mor Bebes, Yoav Tulpan
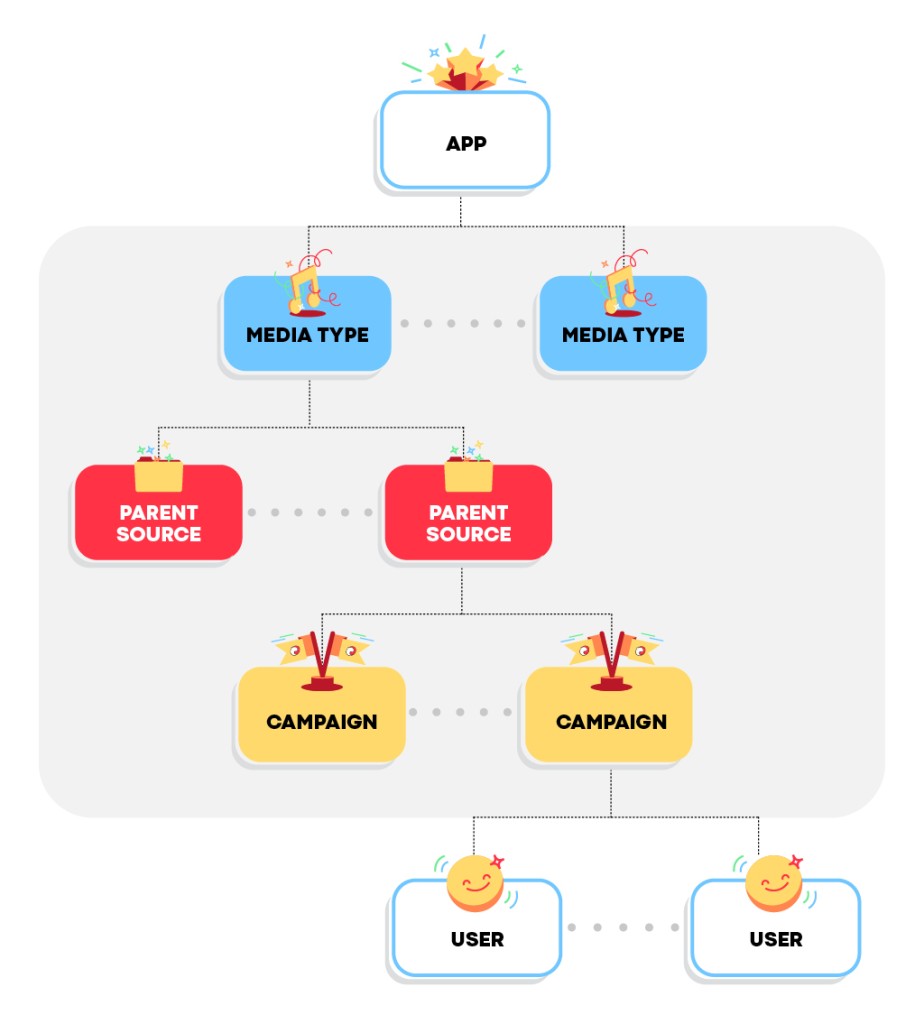
Lifetime value (LTV) prediction is a fundamental task in marketing mix modeling (MMM). While customer LTV (CLTV) usually takes the spotlight, predicting LTV for various cohort levels provides alternative insights for marketing practitioners. These cohort levels typically range from the campaign level, progressing through parent source and media type, up to the application level, as depicted in Figure 1. Specifically, media buyers benefit from campaign-level and parent-source-level insights for their campaign portfolios, while marketing directors and managers favor an accurate view of the various apps and platforms under their control. Typically, higher aggregation levels require better predictive performance due to their closer association with management decisions. In this article, we present the challenges associated with LTV prediction for marketing campaigns across multiple aggregation levels.
Challenge 1: The Data
Usually, data in its raw form is collected at the user level, with each record representing an event of a user in the app. Among these events are installs, first-time deposits, purchases, and other app-specific events. By processing the data, metadata and events of each user are grouped into a single record containing both static and time-series features, corresponding to the user’s attribution and the events timeline, respectively.
At this point, two options are available for the prediction scheme:
- Aggregate-and-predict: Instead of applying CLTV prediction methods directly to the data, the data is first aggregated to the lowest required level, e.g. campaign-level. Then, MMM approaches are applied to the accumulated data to obtain campaign-level predictions. Finally, the predictions are further aggregated to the remaining required levels. The main drawback of this approach is the resolution toll imposed during the aggregation step, as the algorithm becomes blind to the variance in user-level actions. Moreover, this approach significantly reduces the number of effective data points, limiting the use of state-of-the-art prediction methods.
- Predict-and-aggregate: The data is first used to obtain CLTV predictions and then aggregated to the required aggregation levels. The downside here is Simpson’s paradox. Specifically, accurate user-level predictions do not guarantee accurate predictions at higher aggregation levels. For example, the base predictions may be accurate on average, but if they all have a small overshooting bias, the aggregation of these predictions to the campaign level would result in a significantly high overshooting bias for campaigns.
Challenge 2: The Metric
Mean absolute percentage error (MAPE) is a common metric among business managers, defined as:
\(\frac{1}{\#instances}\sum_{instances}\frac{\left|{\widehat{LTV}}_i-{LTV}_i\right|}{LTV_i},\)
where the instances could represent campaigns, parent sources, etc., according to the chosen aggregation level. Its popularity is due to its simplicity, intuitiveness and interpretability. However, MAPE’s reliance on dividing each error by its corresponding true LTV means it is disproportionately affected by low reference values. Consequently, high errors associated with low reference values significantly impact MAPE. Specifically, a zero LTV value and a positive prediction result in an infinite error value.
Challenge 3: Campaign-Level to App-Level Tension
The tension between accurate CLTV predictions and accurate campaign predictions, as demonstrated in the second item of Challenge 1, applies to any pair of aggregation levels. The following inequality, which is derived from the triangle inequality, exemplifies this tension:
\(\small\begin{aligned}\sum_{aggregated\ instances}\frac{|\sum_{relevant\ instances}\widehat{LTV}_i – \sum_{relevant\ instances}{LTV}_i|}{\sum_{relevant\ instances}{LTV}_i}&\le \\\sum_{aggregated\ instances}&\frac{\sum_{relevant\ instances}|\widehat{LTV}_i – {LTV}_i|}{\sum_{relevant\ instances}{LTV}i}\le \\ &\ \ \ \ \ \ \ \ \ \ \ \ \ \ \ \ \ \ \ \ \ \ \ \ \ \ \ \ \ \ \ \ \ \ \ \ \ \ \ \ \ \ \ \ \ \ \ \ \ \ \ \ \ \sum_{instances}\frac{|\widehat{LTV}_i – {LTV}_i|}{{LTV}_i}.\end{aligned}\)
The left-hand side of this inequality represents the MAPE of a higher aggregation level, while the right-hand side represents the MAPE of a lower aggregation level. While the MAPE of the lower aggregation level serves as a bound on the higher level’s MAPE, the inequality is quite loose. Consequently, this upper bound is not tight. Hence, optimizing errors at a lower aggregation level, such as campaign level, does not ensure acceptable errors at higher levels, like app level, where better predictive performance is expected.
Challenge 4: Correspondence between Horizons
In addition to the various aggregation levels, predictions are often required for multiple horizons. Specifically, marketing managers are interested in predictions for a predefined payback period, during which the return on investment should approach 100%, while media buyers typically have objectives defined for a shorter term. Consequently, LTV predictions need to be multi-horizon. As a fundamental requirement, the predictions for each horizon should correspond with those of other horizons, meaning that as the horizon lengthens, the predictions should increase accordingly. There may be additional requirements as well.
Summary
In the dynamic world of marketing campaigns, the convergence of predictive AI and MMM continues to carve out an exciting frontier in LTV prediction. We are venturing into a realm that uncovers the interplay between predictive technology and business foresight, showcasing AI’s capacity to elevate the strategic insights of business analysts. This journey involves navigating through the complexities of data aggregation, MAPE evaluation, ensuring consistency across different cohort levels, and maintaining correspondence between multiple prediction horizons. Ultimately, we shall witness how AI evolves into an essential partner in crafting nuanced LTV predictions for multiple cohort levels. In our upcoming blog posts, we will delve into the technical intricacies of our research, shedding light on the methodologies and innovations driving accurate LTV predictions that cater to the multifaceted demands of various stakeholders.
Stay tuned!