A/Bove All Else, Testing is Essential
By Dario d’Andrea, Jérôme Carayol & Armand Valsesia
A/B testing is a controlled experiment that compares two (or more) variants and determines which one performs better according to predefined criteria.
For example, A/B testing compares evolving functionalities and identifies the one that best improves users’ experience for a specific game. Such comparisons are based upon rigorous statistical methodologies.
A typical A/B test consists of selecting a subset of users representative of the target population and then randomly split them into two groups:
- The Control Group that gets the original functionality.
- The Test Group that gets the new version.
Metrics such as gameplay style, user’s feedback, and others are then analyzed with ad-hoc statistical methods to determine which of the two versions yields the best results. That version is then rolled out to the targeted population of game players.

Playtika is a gaming company that entertains gamers worldwide with its “infinite ways to play,” as it defines its wide range of games and contents.
To optimize users’ gameplay experience, every modification of Playtika products is evaluated through a rigorous A/B testing process.
To carry on these tests, Playtika’s Artificial Intelligence Lab developed ABexp, a Python library that supports end-to-end A/B test experiment flows. This standalone product helps data scientists, statisticians, and business analysts to run A/B test experiments.
ABexp comprises several modules of the A/B lifecycle (from design to final analysis). The library provides detailed tutorials for people just getting acquainted with A/B testing. The code is written according to standard best practices and provides comprehensive API documentation. The full library is available as an open-source product and can be downloaded from GitHub.
Deep Dive into A/B testing
The A/B test flow is structured in several distinct phases (see Figure 2) explained in detail below.
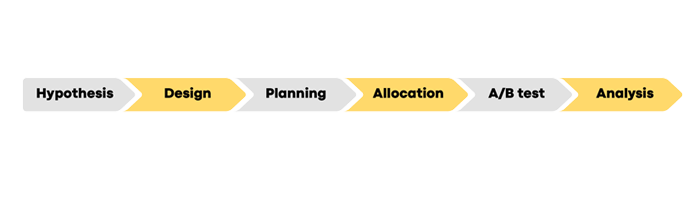
Hypothesis
In A/B testing, the hypothesis typically claims that a specific metric could be improved by modifying an element of the game. The selected metrics can be any continuous or discrete data, as long as it is measurable.
For example: Games regularly introduce new content, such as a new mission, new levels or seasonal events. This new content provides fresh entertainment to users and strives to enhance their game experience. The new content can have different flavors, raising questions about which flavor would best improve the players’ game experience.
This is where A/B testing is required to determine which of the two versions is preferred by users.
First and foremost, a metric of success needs to be defined. The choice of metric to use depends on the nature of what is being tested and the selected goals.
When comparing the user experience of two versions of a similar event, the selected metrics could include:
- The proportion of users who completed the game challenge,
- Or the proportion of users who played it a defined minimum amount of time,
- Or the average game-play duration,
- Or even a satisfaction survey (e.g., “did you enjoyed playing the challenge?”).
Once a metric is selected, the next step is to define the hypotheses to evaluate. This is the foundation of the A/B testing process and crucial to the success of the comparison.
Two hypotheses are opposed:
- The null hypothesis – the two game versions do not produce any significant difference for the selected metrics.
- The alternative hypothesis – one of the two versions yields a better metric of success (e.g., increased challenge completion by 10%).
These hypotheses are key to reaching a conclusion:
- If the null hypothesis is met, then you cannot conclude that any game version is better. This can be either because both versions are equivalent, or because the A/B test design does not allow to conclude (e.g., the metric of success was not a good metric).
- If the alternative hypothesis is met, then the conclusion is easier. One version is clearly better for the tested metric, and a decision can be made to roll out the better version to all game users.
As you can see, an effective hypothesis definition is a major factor to running a meaningful A/B test. It requires:
- Selecting a relevant metric of success. That metric is the central parameter to yield an actionable conclusion, so it is crucial to select one relevant for the problem at hand. An ill-defined metric of success fails to generate any meaningful result, so better invest in defining a significant one.
- Defining the expectation. The alternative hypothesis requires specifying a realistic minimal difference threshold (e.g., increases challenge completion by 10%).
Unrealistically high expectations (e.g., +50%) lead to missing out on actionable results, whilst unreasonably low expectations (e.g., +0.01%) can lead to implementing a new version despite insignificant benefits.
This is why defining these hypotheses, metrics of success, and expectations, is best performed by an expert multi-disciplinary team in possession of all relevant data.
Design
Once the null and alternative hypotheses are set, we can apply statistical methods to estimate how many users per group are required to detect differences (assuming they exist).
For example, suppose we expect to see an increase of over 10% in challenge completion relative to the current game challenge completion rate. In that case, we can use the ABexp function Sample Size Determination (SSD). The library will perform Power Calculation and provide the minimal number of users to include in each group to ensure a reasonable probability of observing the possible differences. Commonly, this probability is set at 80%, but higher values can be used (e.g., 90%).
Planning
We define the test duration in terms of weeks/days and set the start and end date of the experiment. This phase requires taking into consideration the number of eligible users available on our platform on a daily basis.
Allocation
Control and Test(s) groups are defined using the ABexp Allocation module. That module either randomly allocates users to groups (aka “complete randomization”) or uses a more sophisticated approach that also randomly allocates users but accounts for specific user characteristics (aka “block randomization”). Defining homogeneous groups and avoiding any bias is crucial to ensure the experiment’s success.
Run the A/B test
Once all the above is ready, you can start the A/B test itself. This consists in presenting the new version to the test group, monitoring the control group, and collecting the data.
Analysis
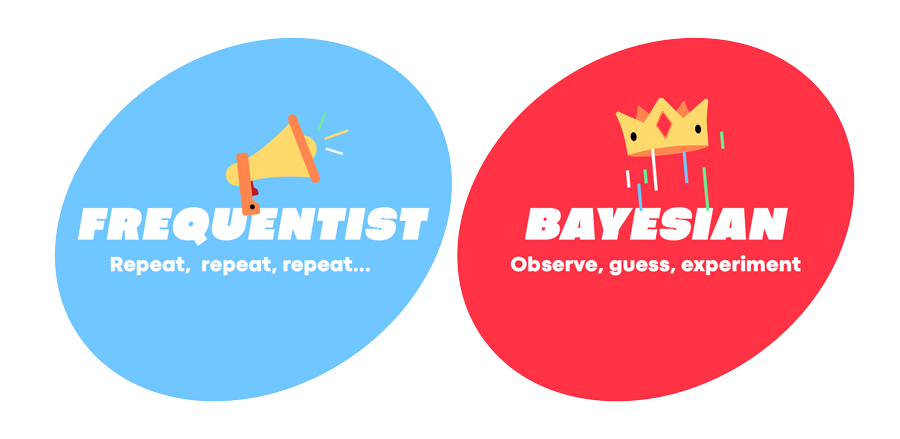
Upon A/B test completion, the data are analyzed with statistical techniques. Playtika’s ABexp solution accommodates both the Frequentist and Bayesian approaches.
These two statistical approaches have been used for decades, and the essential differences between them are briefly summarized below.
The Frequentist approach is based on the repetition of an event and whether such occurrence looks extreme under the scenario that the two groups are similar (null hypothesis). Specifically, the Frequentist method calculates the p-value, which is the probability of observing a result at least as extreme as the data under the null hypothesis. When the p-value is smaller than 5%, we reject the null hypothesis and conclude that there is a difference between the two groups. When the p-value is greater than 5%, no conclusion can be made (i.e., there might be no difference, or the information in the data is insufficient to detect this difference).
The Frequentist approach also considers the population parameter for each variant as an unknown constant, with assumptions about the data distribution.
The Bayesian approach is more flexible regarding the underlying data properties because each parameter can be modeled as a random variable with some probability distribution (i.e., a belief, called prior probability).
For example, the alternative hypothesis relies on the belief that the new game challenge will yield +10% completion when compared to the old challenge. To test this belief, the A/B test generates data (i.e., the data provides evidence.) The Bayes’ rule computes the probability of the alternative hypothesis being true given the evidence (i.e., posterior probability). This probability may read like “in 96% of the cases, the new challenge has +10% more completion than the old game challenge.” Therefore, the new version yields significantly better in terms of the gameplay experience, as measured from challenge completion rates. Conversely, if the probability was close to 50%, the conclusion would be that the two-game versions yield similar experience.
Playtika’s ABexp solution is available here and comes with a set of tutorials available here. Feel free to use Playtika’s ABexp solution to run your own A/B testing.